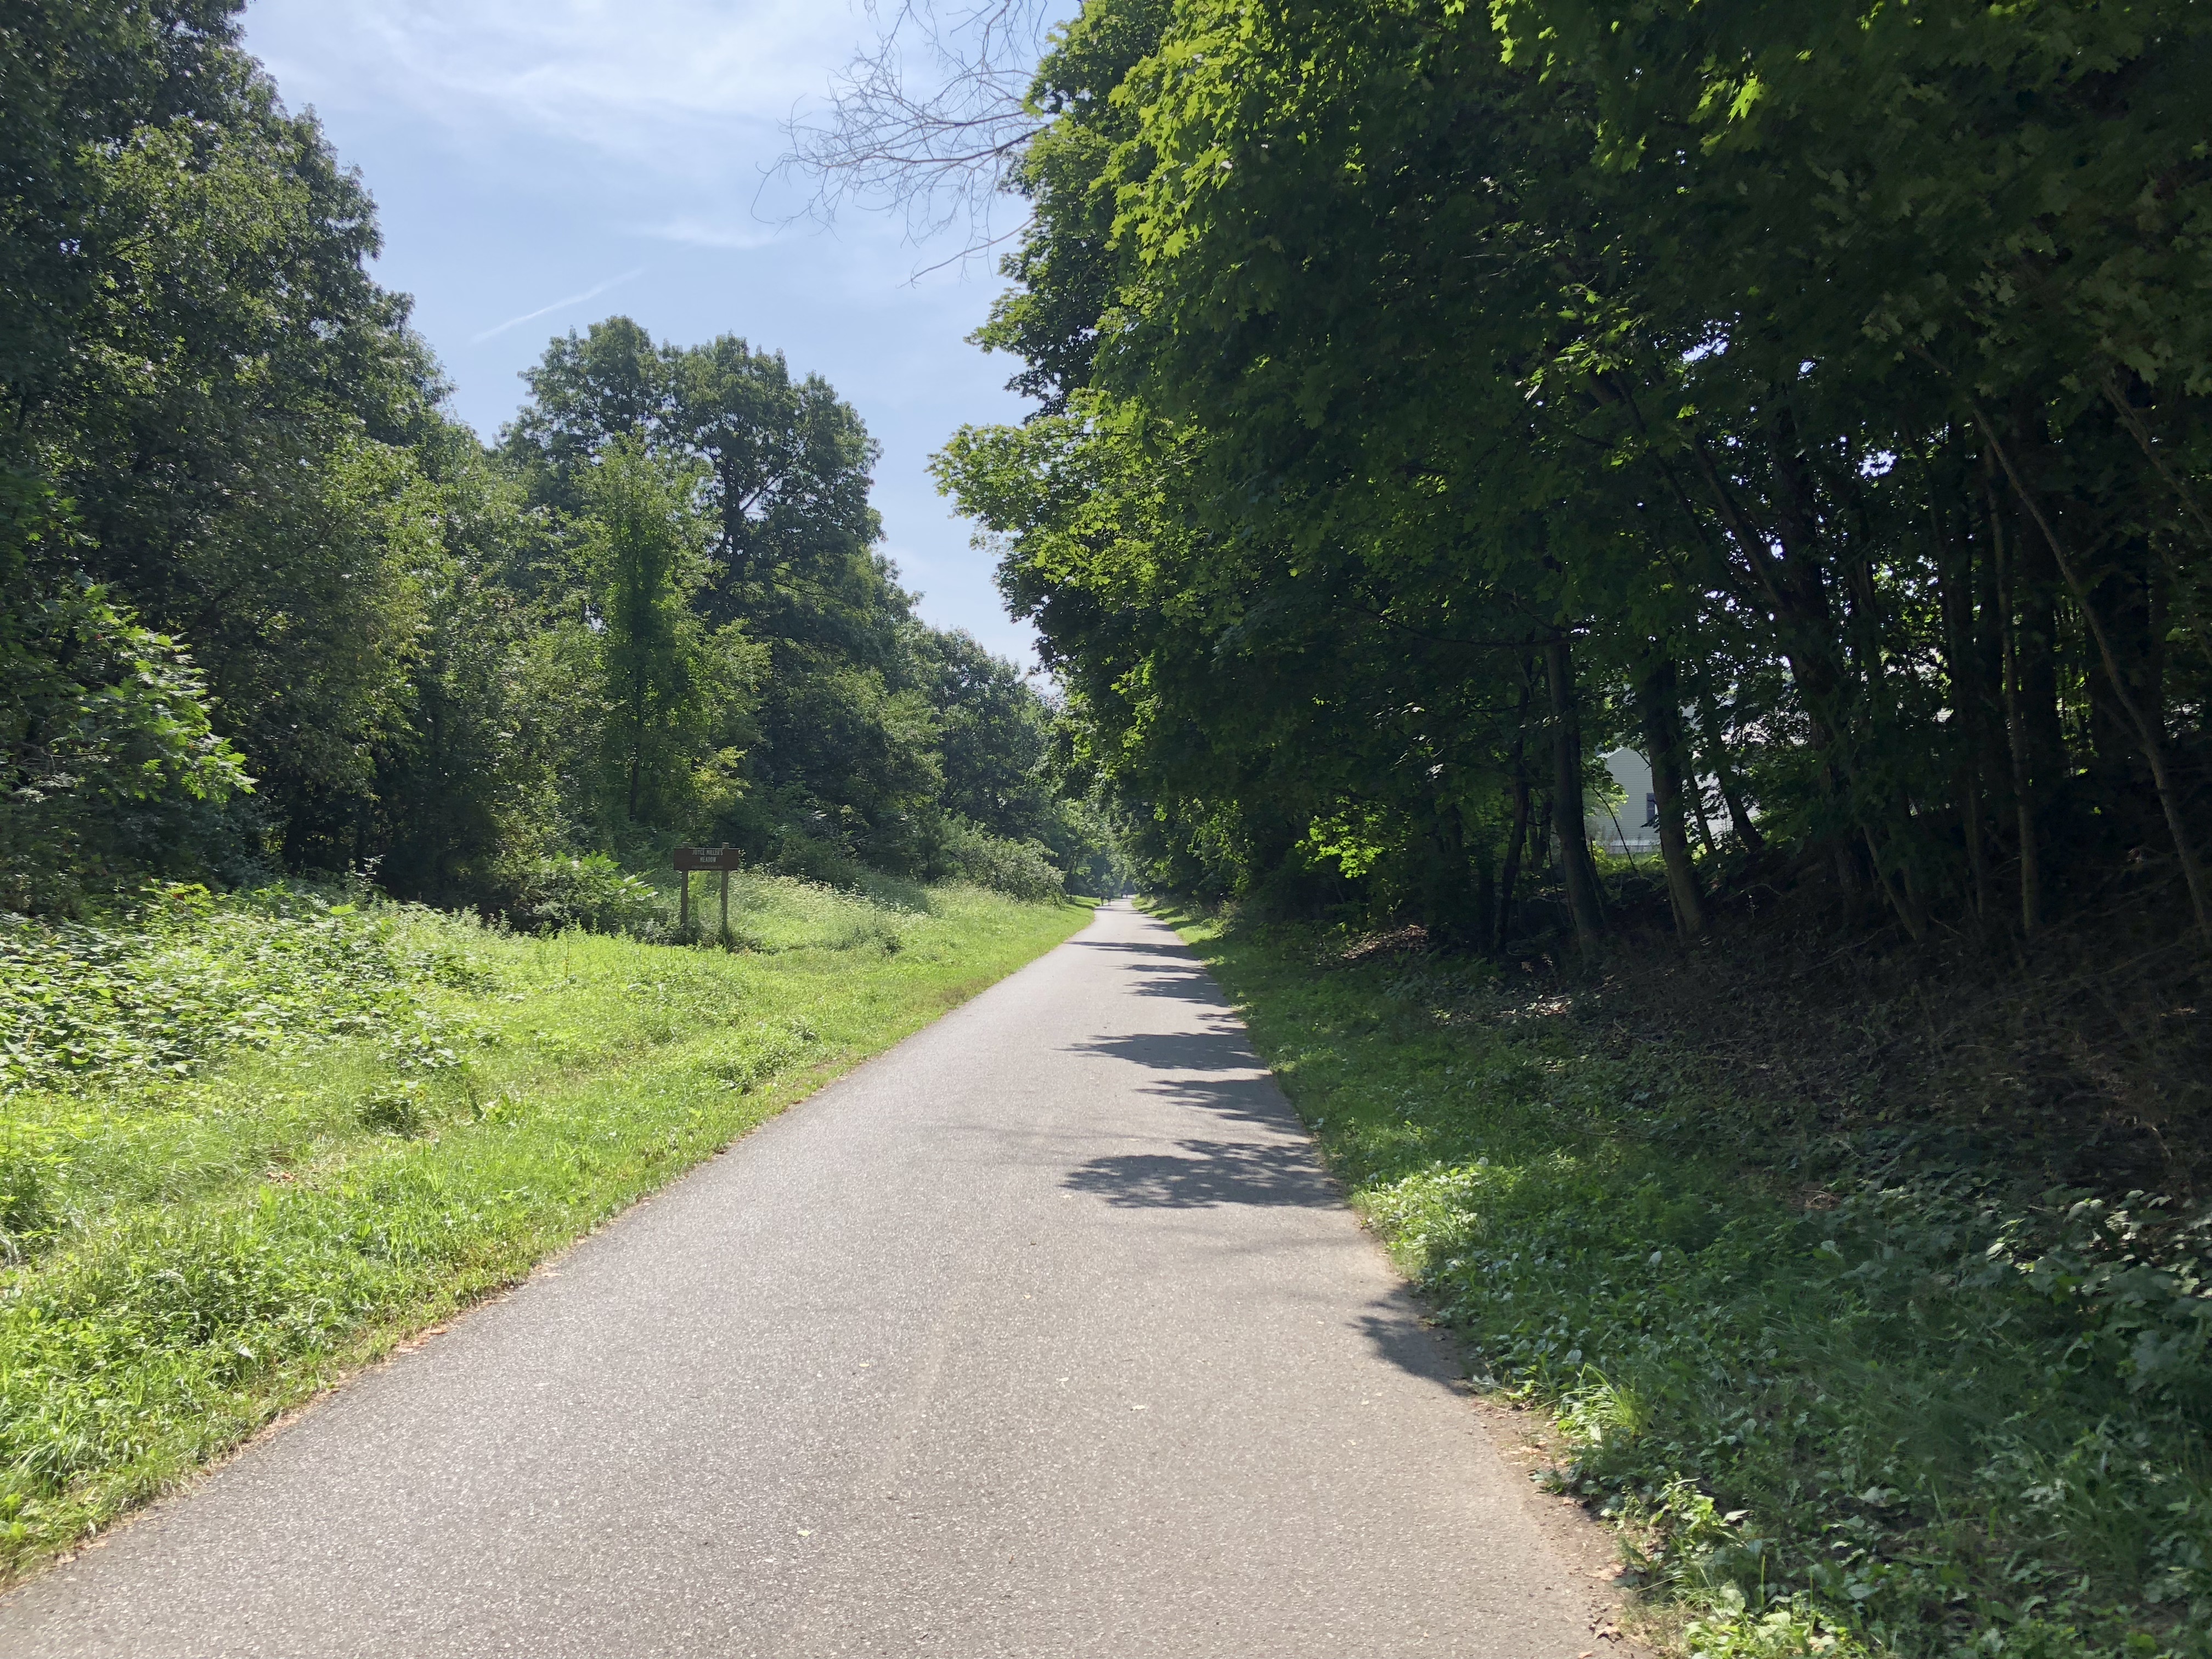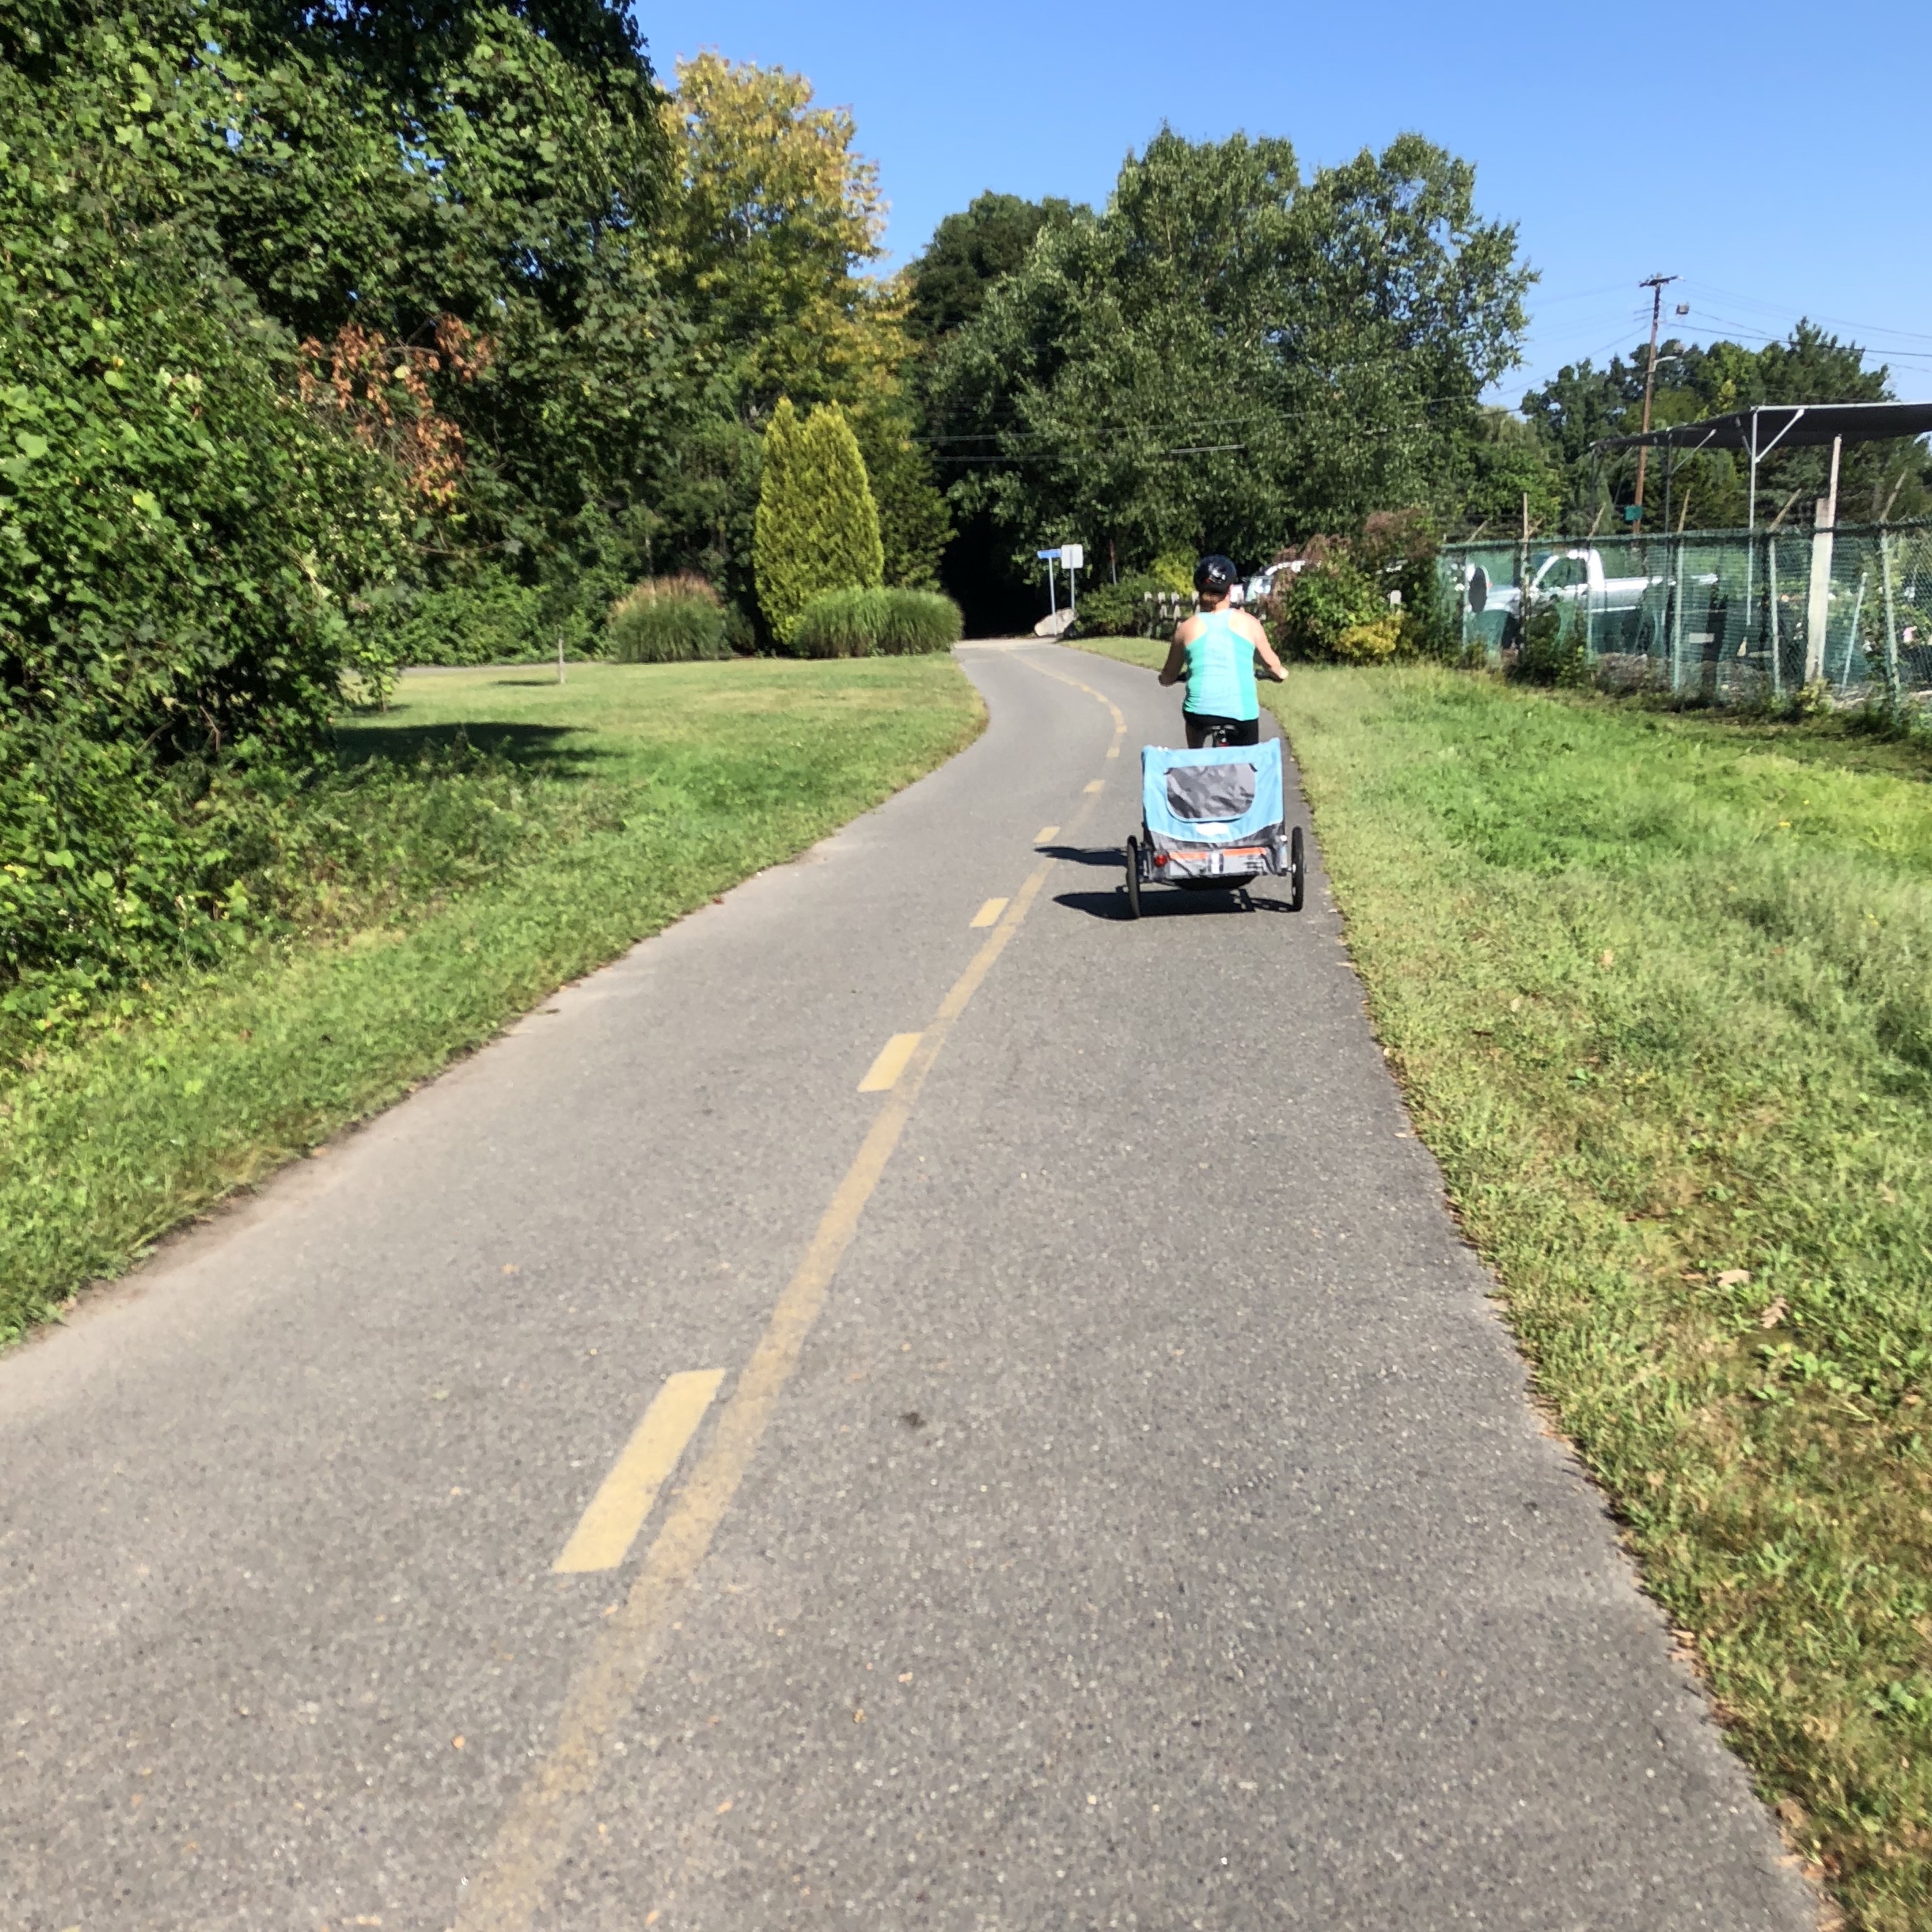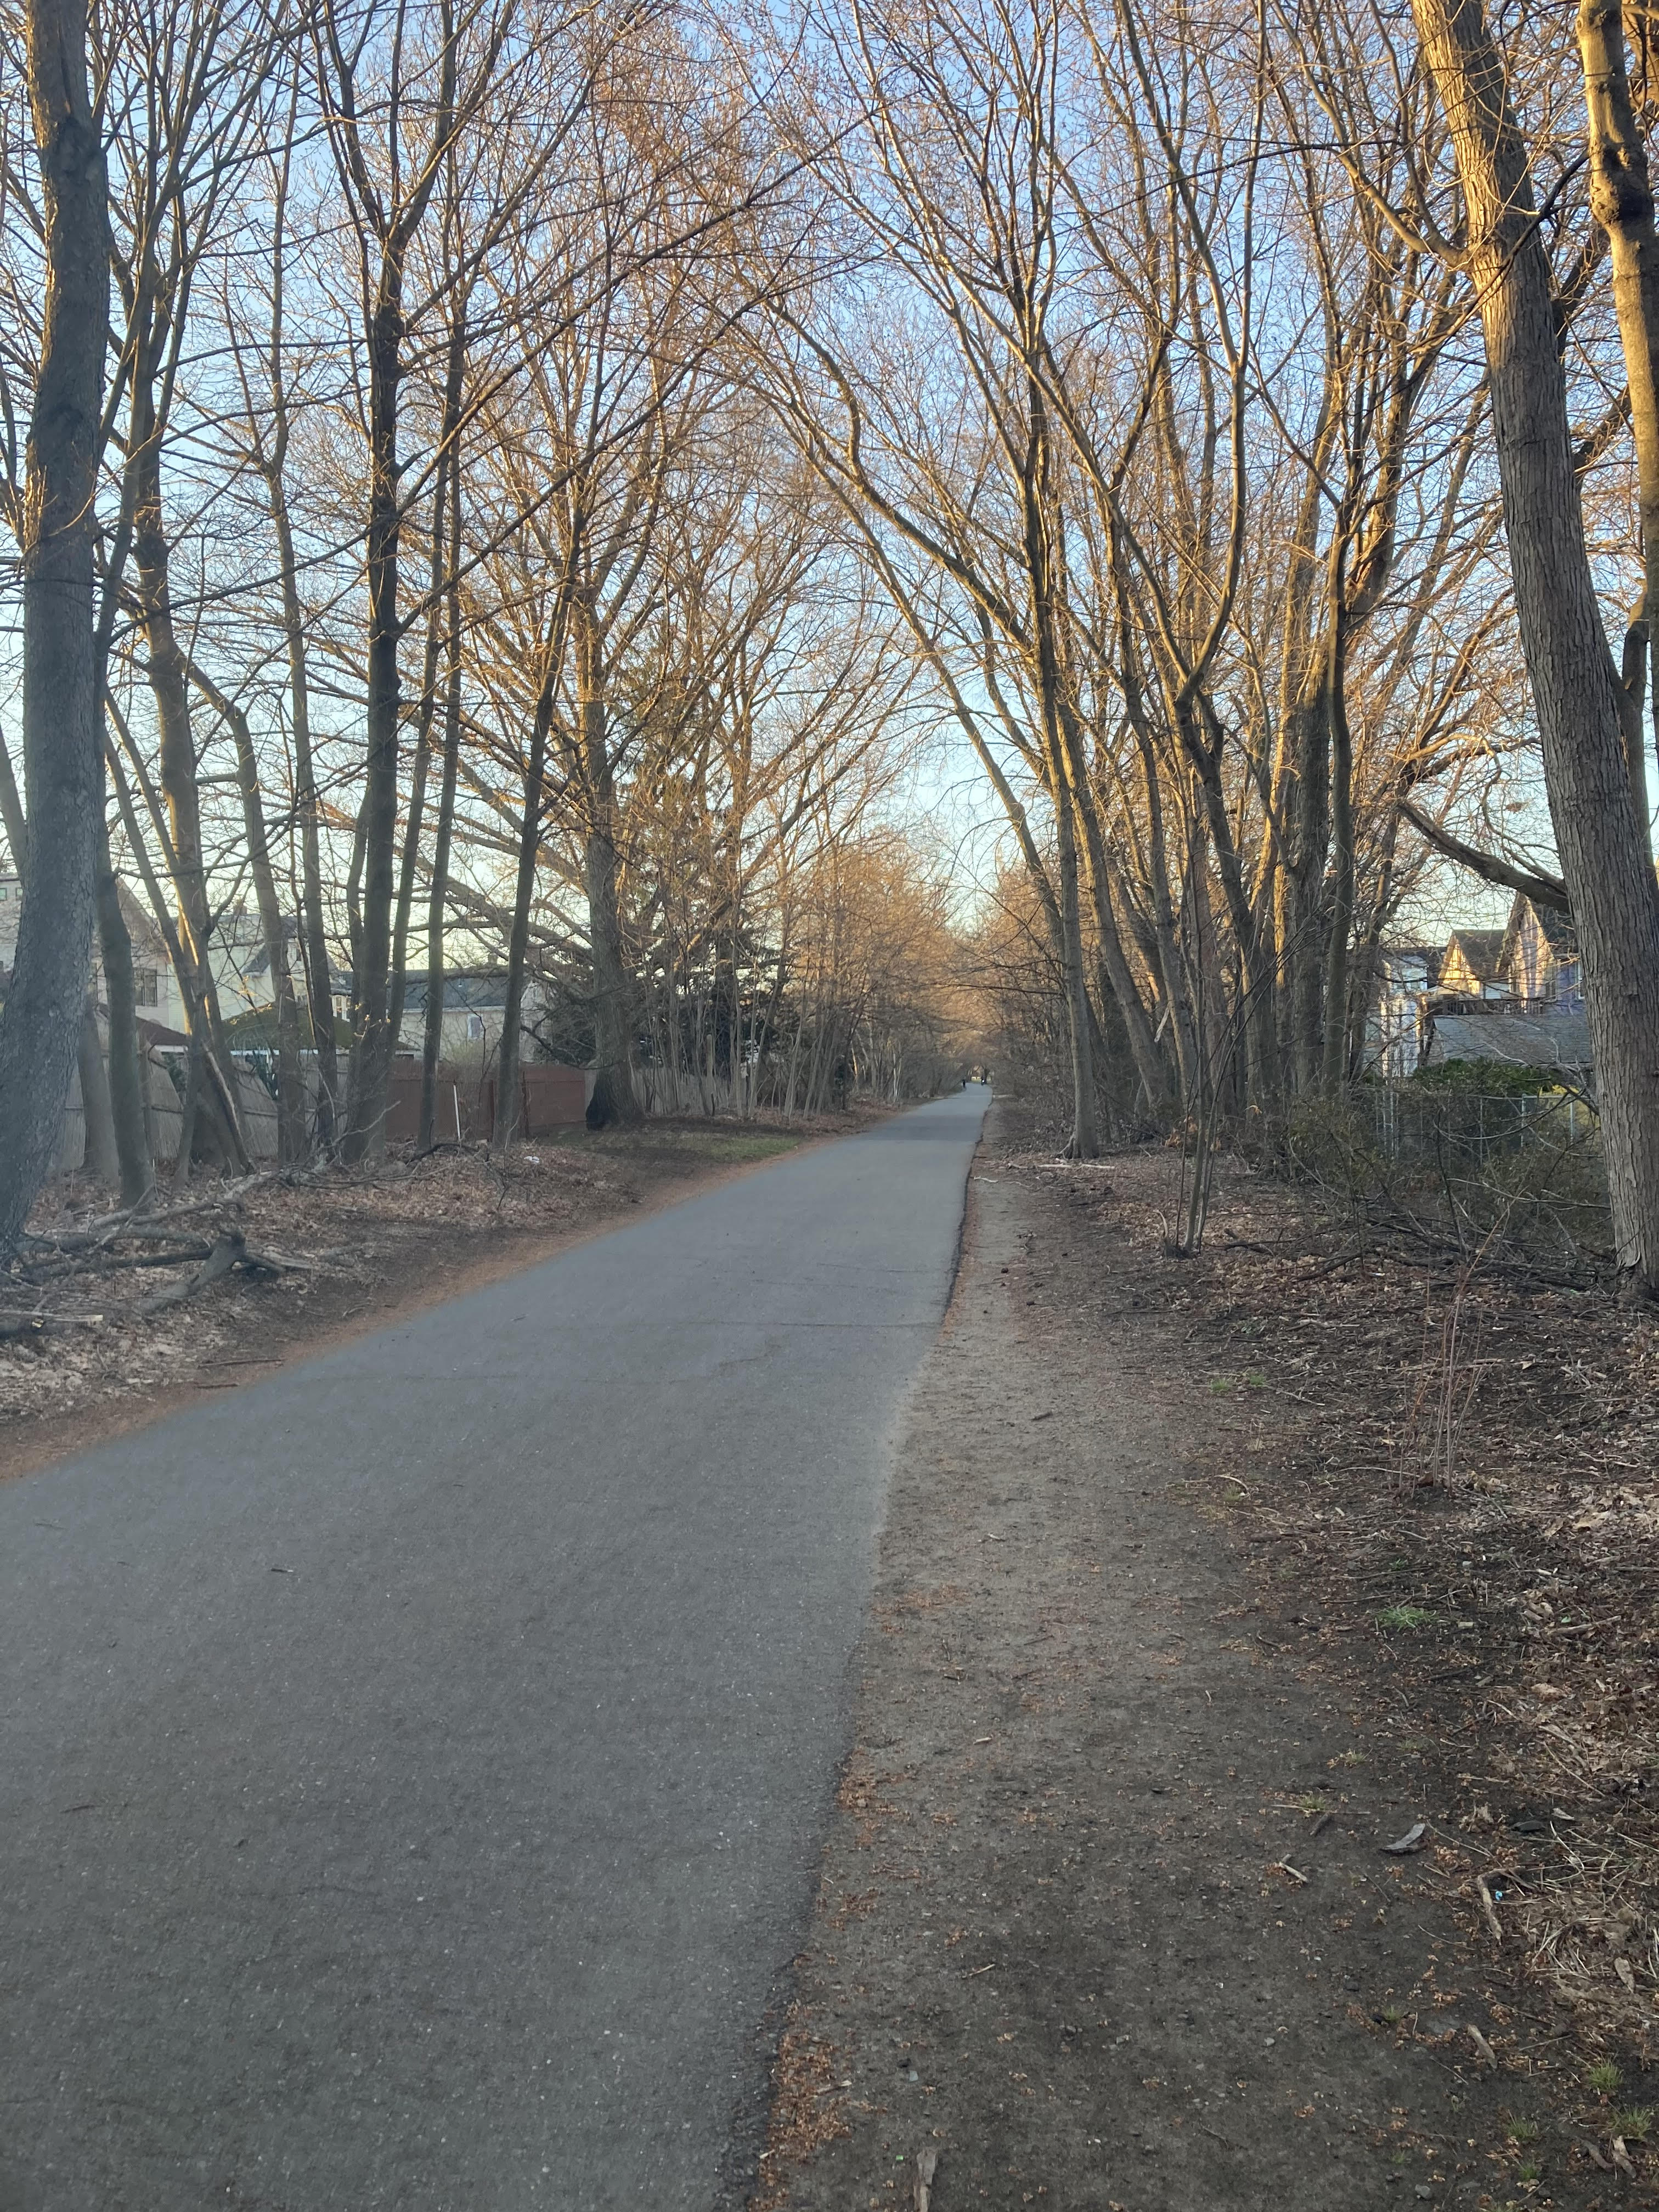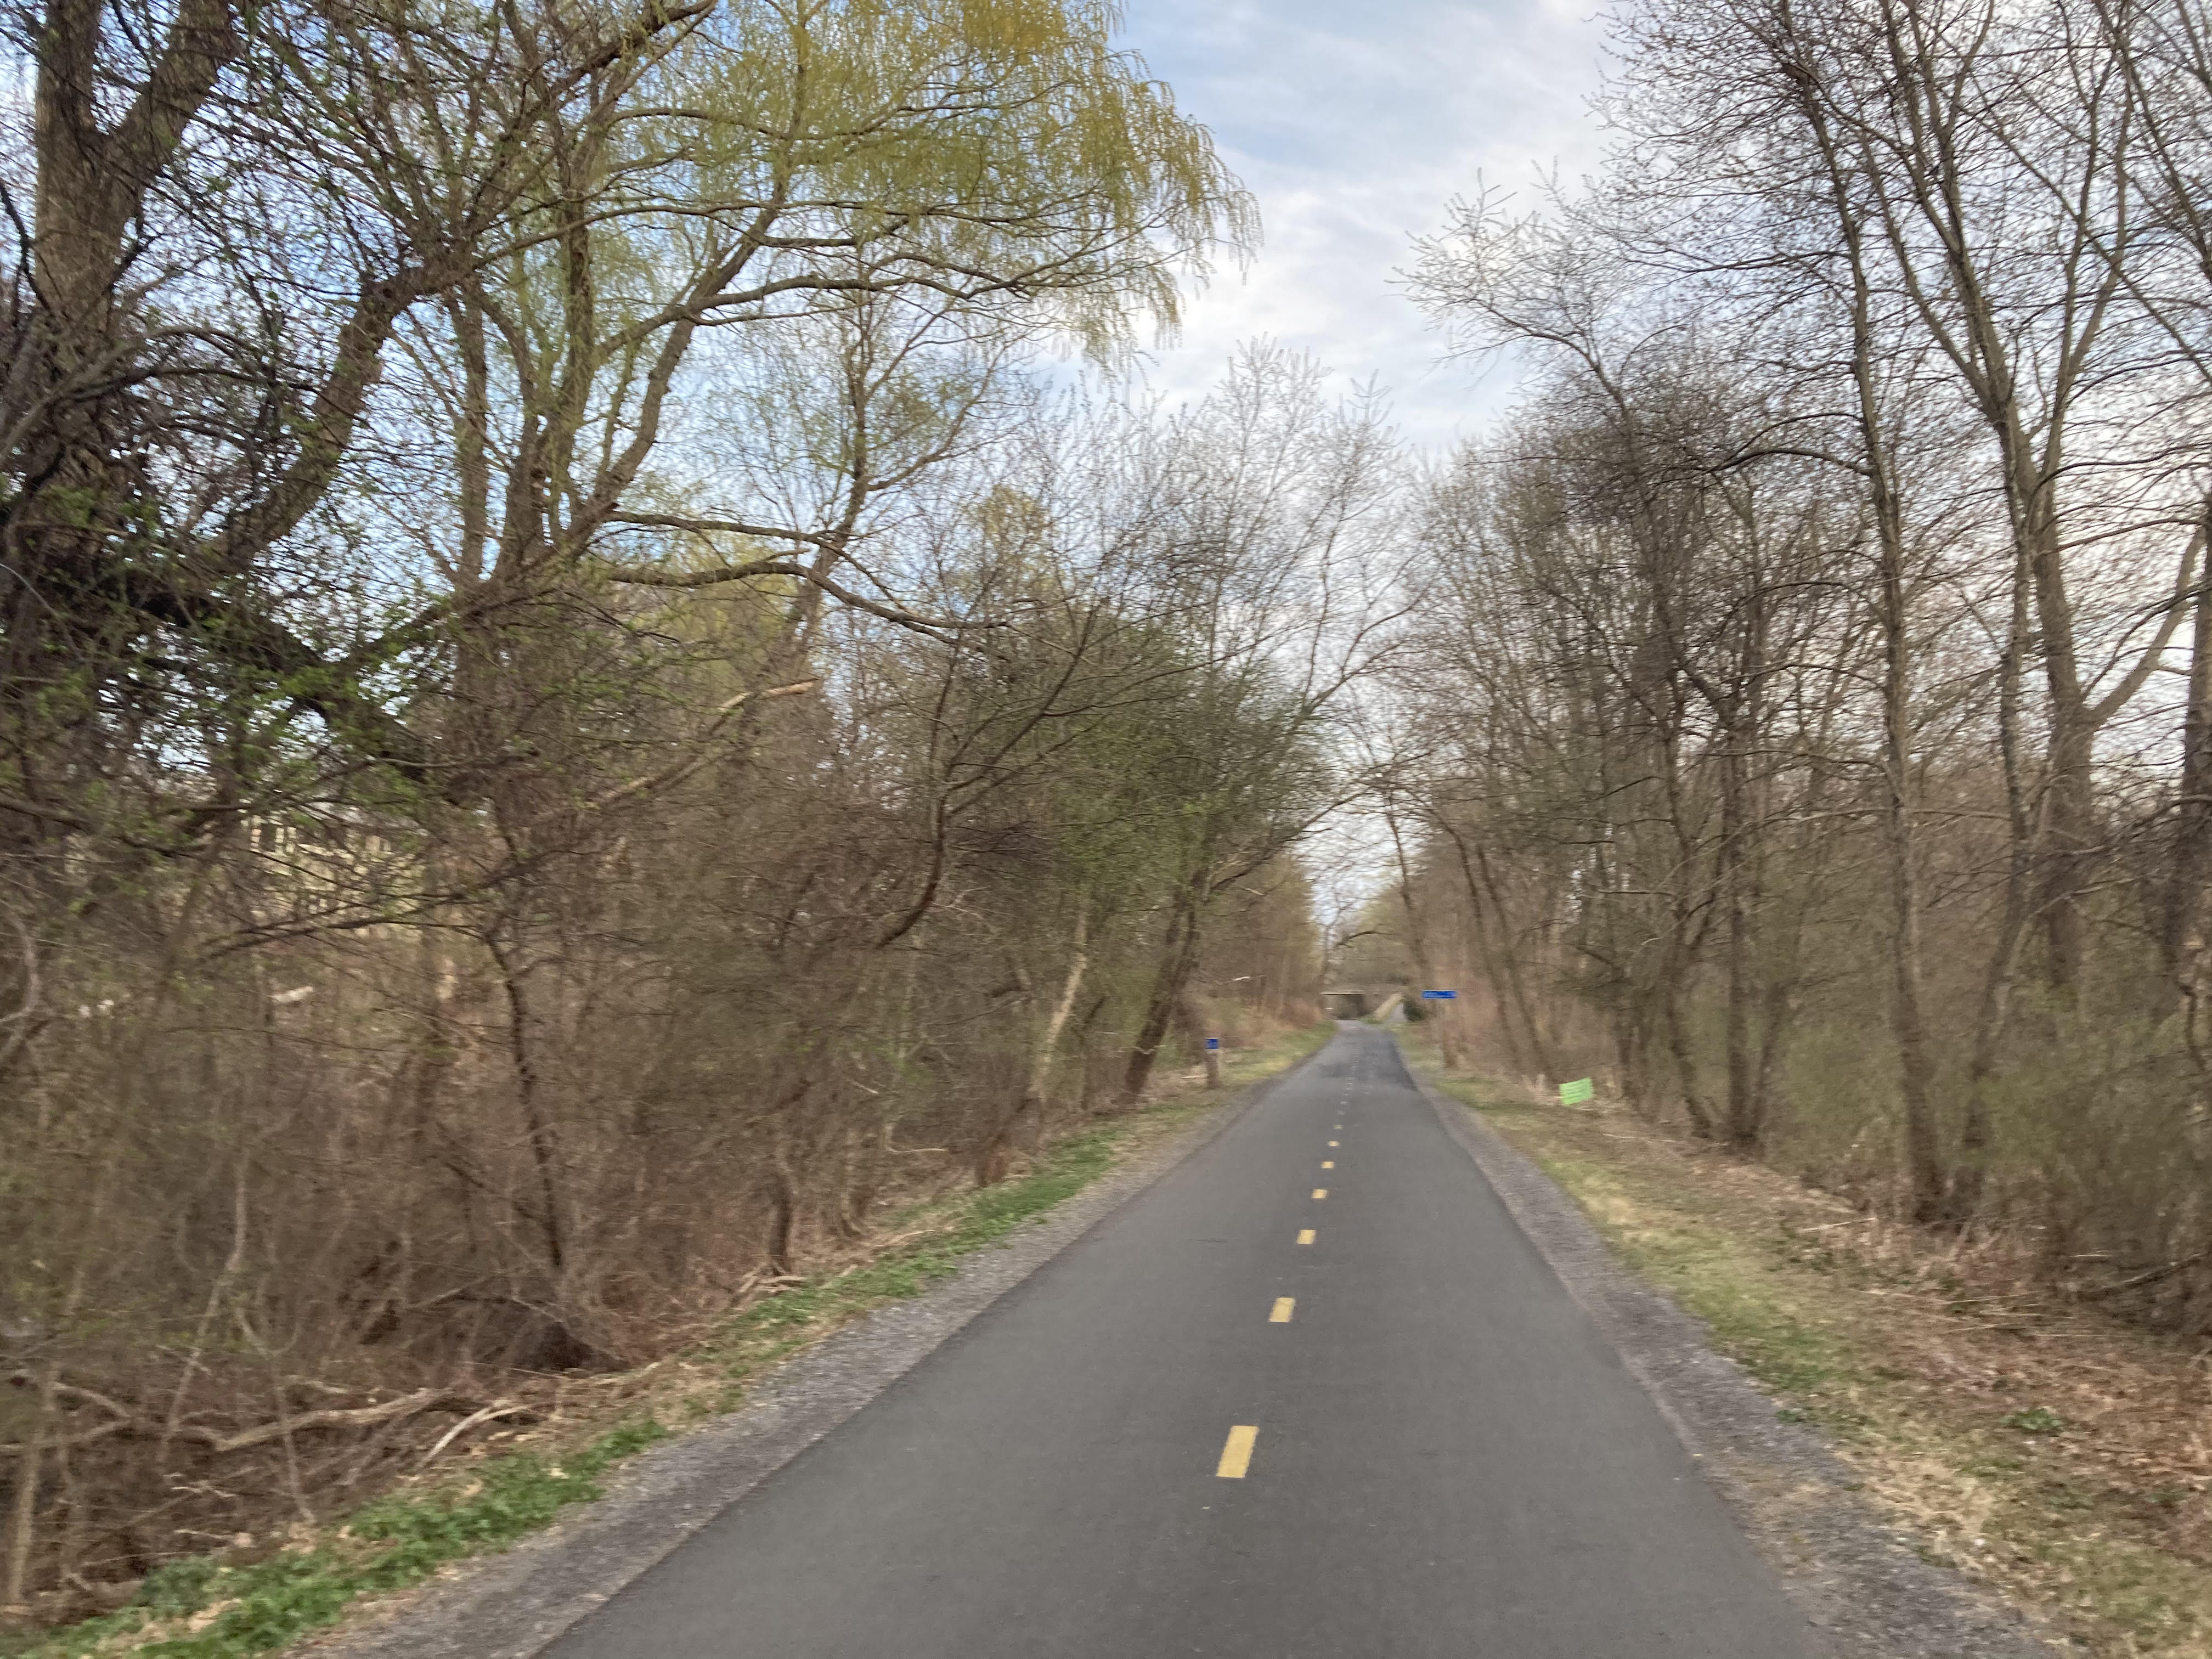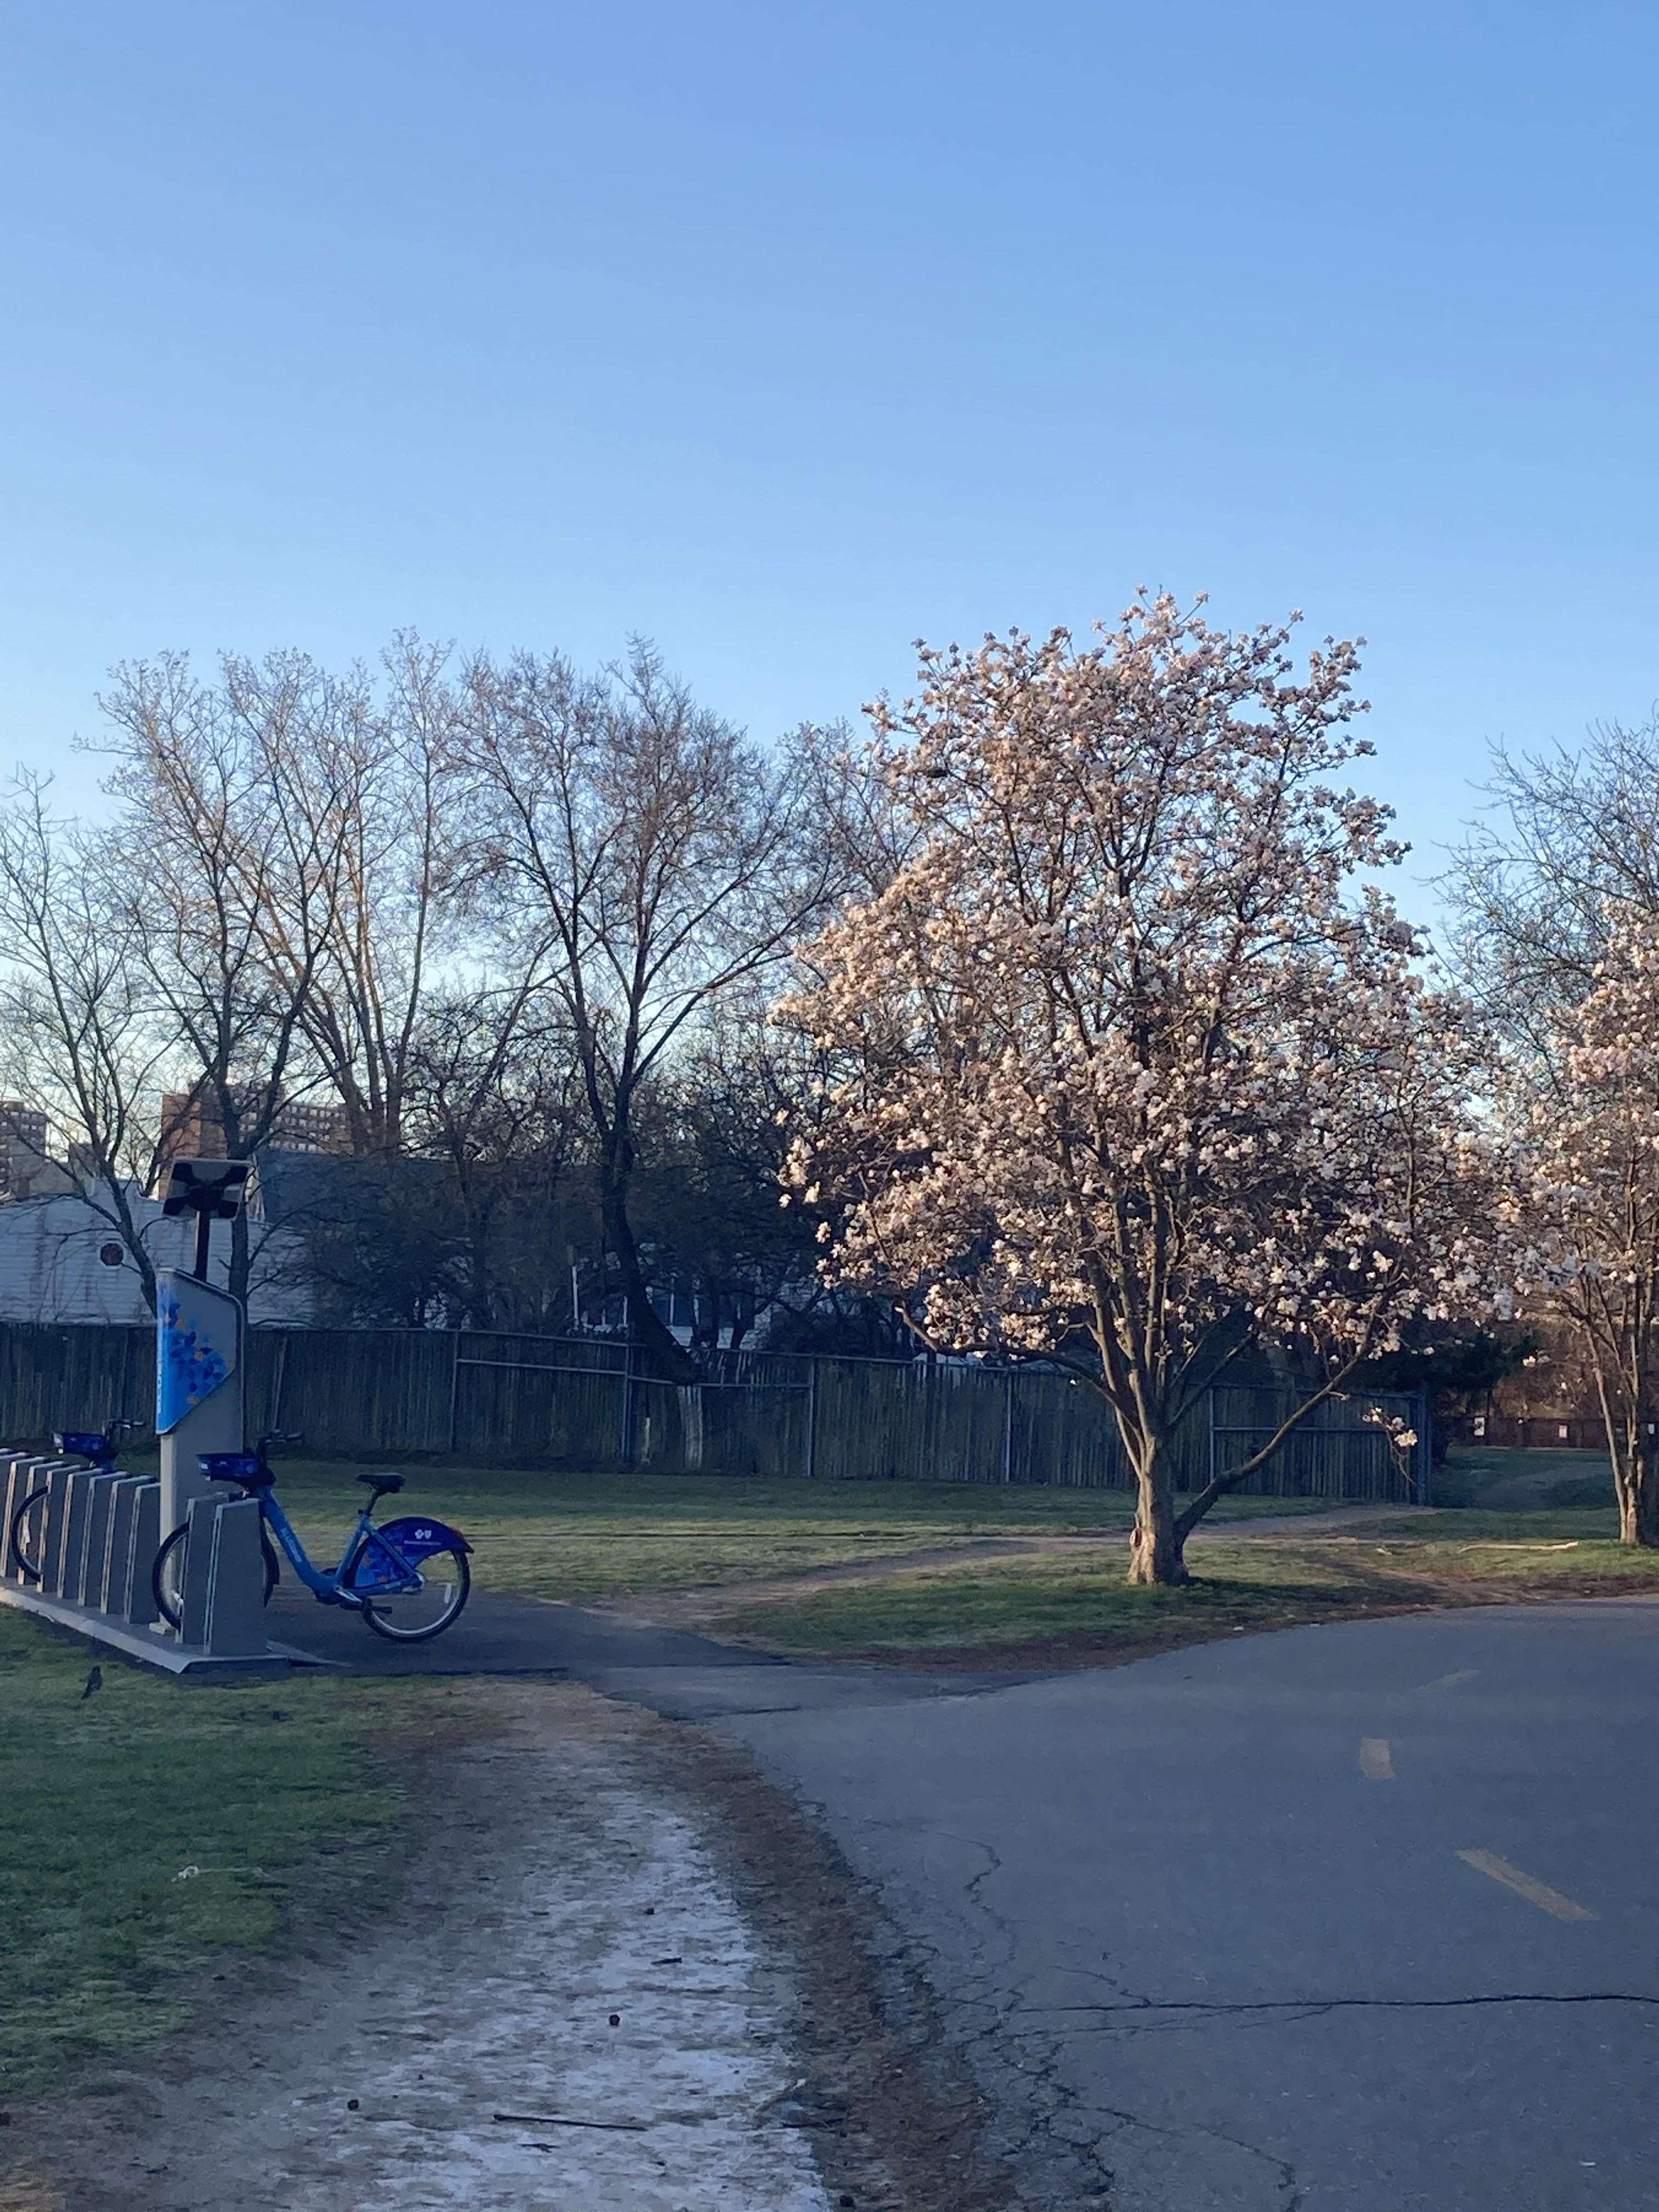


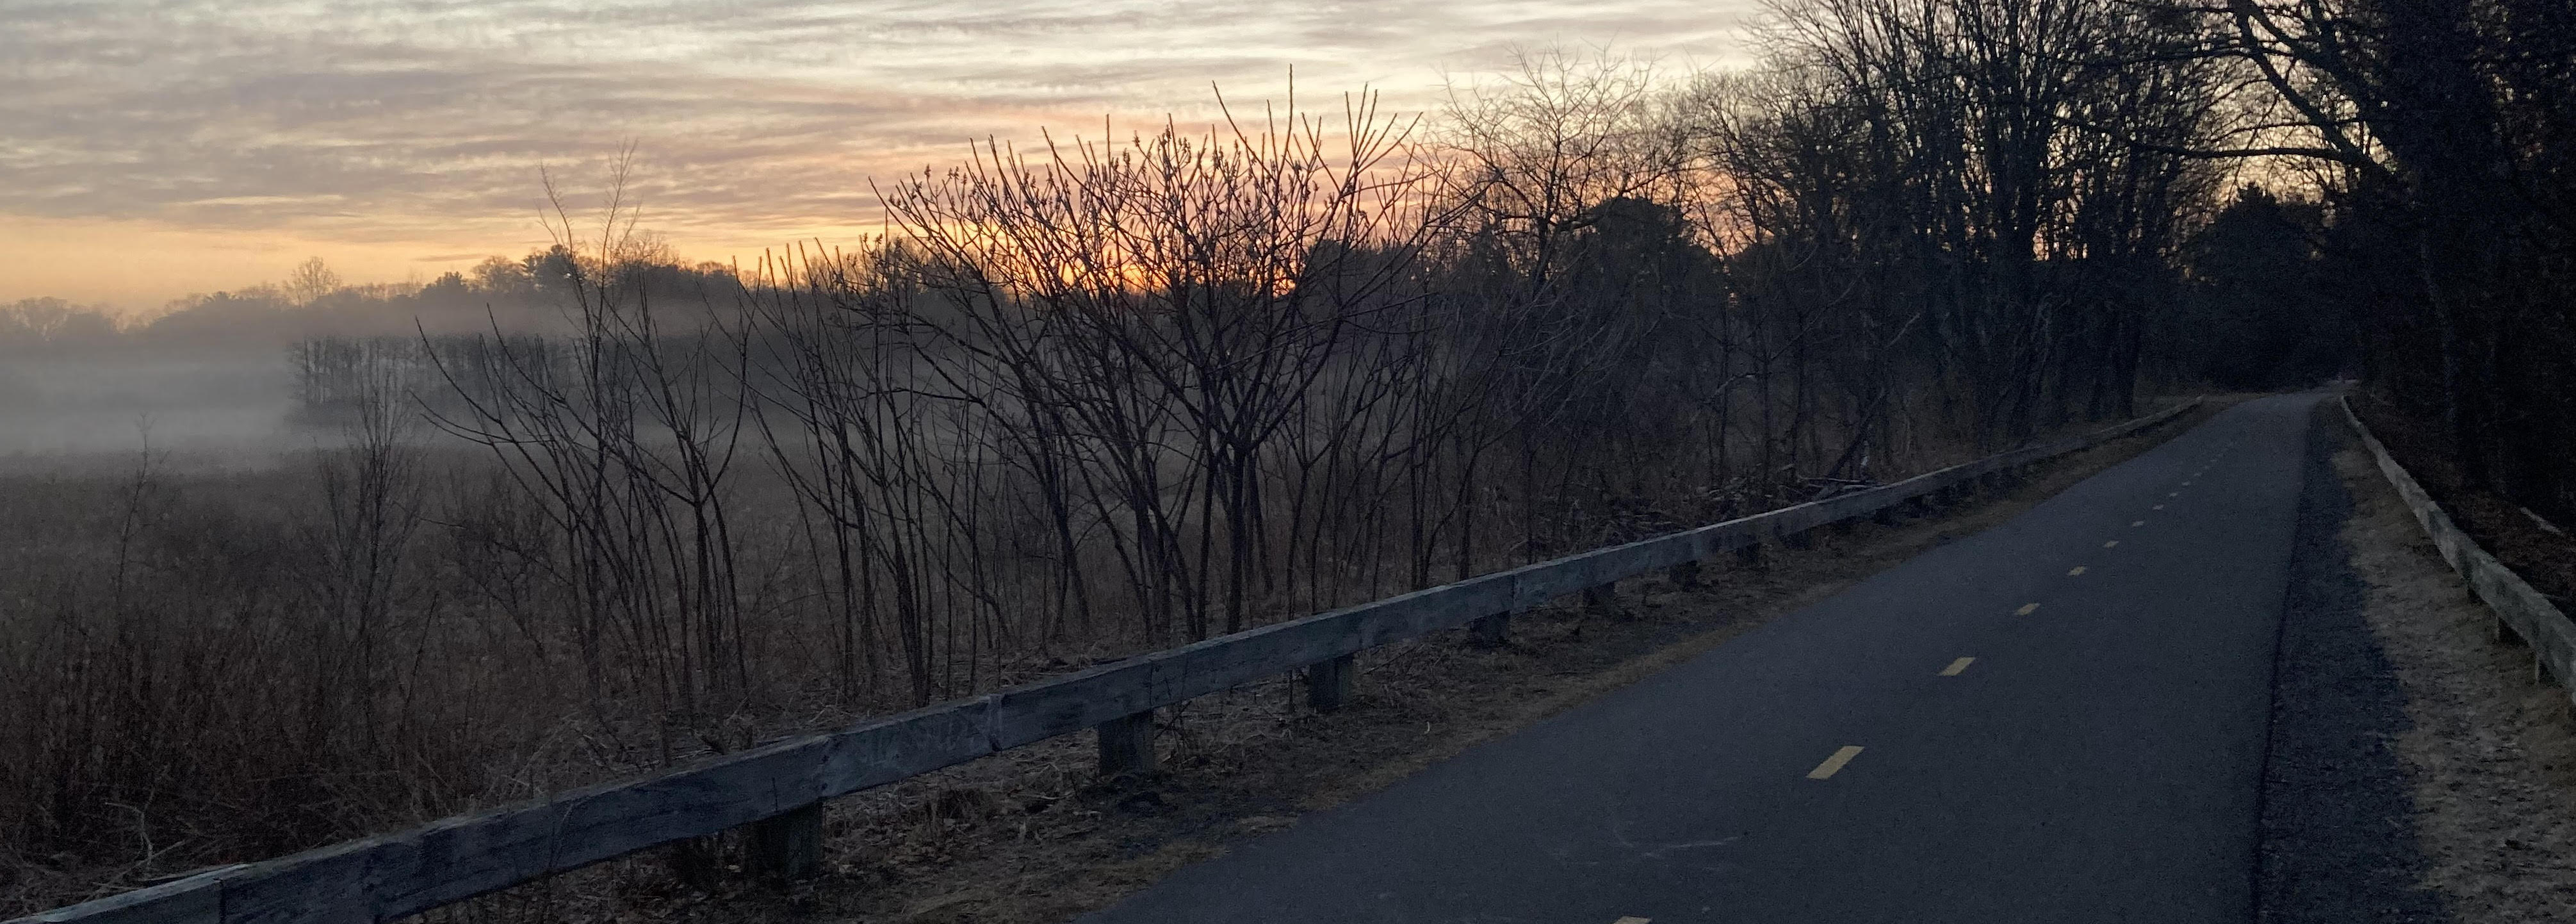
- The Pedal Index is a measure on a scale of 0 to 100 of how comfortable the weather will be for cycling on the Minuteman Bikeway in eastern Massachusetts
- The index combines temperature, humidity, winds, precipitation and cloud cover to give a score for morning, midday and evening of the next day
- A 100 represents perfect conditions and 0 is pure misery
This project started when I found that, even as a meteorologist, I would consistently forget to check the weather forecast the evening before my bike-commute and then have to make a rushed decision the next morning whether to take the bike trail or take the bus to Alewife. Rushed decisions are often bad ones and there were plenty of afternoons I would be biking home in the rain, or riding a packed bus on a beautiful day. What I needed was to have the relevant weather information pushed to me in a more curated way. The Pedal Index combines the forecasted weather conditions for the Minuteman Bikeway into a single score that quickly communicates whether it's a go, no-go, or whether more weather context is needed.
The process for combining weather conditions into the index consists of my own preferences for being on the bike trail. For example, my ideal cycling temperature is in the lower 60s and the index reflects this. For some riders this might be cooler than is comfortable, or a little on the warm side. A perfect score of 100 means an air temperature in the lower 60s, a comfortable dewpoint temperature, a negligible chance of precipitation, light winds, and a dry trail. Most of these preferences are, I would guess, universal among cyclists, but it is worth considering them against your own likes and dislikes when you are looking at the index. In case you are wondering, I would rather not ride on a Pedal Index below 30. Some of my former biking partners would say I've gone soft. Maybe you, like them, are a hardcore rider who wouldn't want to miss being out there in a 35-degree drizzle or a sub-zero windchill. If that describes you then you may prefer to ignore the index and just check the forecast details to help you decide what to wear.
If you object to distilling something as nuanced and variable as the weather down to a single number then I understand and typically I would agree. My response here is that in some cases a simplification can be useful and the bike trail forecast is one of those cases for me. I hope that you also find it useful and informative.
Constructing the Pedal Index begins with collecting the appropriate weather forecast data from the National Oceanic and Atmospheric Administration (NOAA) forecast models. Data from the North American Mesoscale Forecast System (NAM) and the Global Forecast System (GFS) are both used and weighted equally in the calculation. The model forecasts for KBOS (Logan Airport) and KBED (Hanscom Field Airport) are merged with a heavier weight given to the KBED data which will in general be more in line with the conditions on the bike trail. From the model data, the expected temperature, dewpoint, probability of precipitation, precipitation amount, precipitation type, cloud cover, visibility and wind speed and direction are recorded for the forecast period.
The index calculation begins with temperature - the air temperature, or the effective temperature (either the wind chill or heat index when conditions support their use). A base score is calculated from the temperature and then penalties are applied to the base score to give the final Pedal Index. The largest penalties result from a high probability of precipitation, especially if the precipitation is expected to be heavy, but penalties are also applied for conditions of high humidity, strong winds, poor visibility and a wet trail. Additional reductions to the score are applied if there is a significant chance of thunderstorms in the area, especially severe thunderstorms, since these conditions can pose a safety risk. Please refer to the National Weather Service and Storm Prediction Center for hazardous weather information and watches/warnings.
The magnitude of each penalty varies by the hazard in question and is proportional to the degree of the hazard. For example, 10-15 mph winds can dampen the enjoyment of cycling in a small way and, therefore, result in a small penalty of about 5 to 10 points. Stronger winds of 25-35 mph become a hazard for cycling and will be about the only thing you are thinking of while out on the trail, so these more intense winds result in a much more substantial penalty. Of course, a moderate wind, if it’s coming from the tail direction, can actually be a bonus for riding, or as a head-wind can be even more of an obstacle to enjoyment. Tail-winds and head-winds are not explicit in the index but a bonus for a tail-wind, or additional penalty for a head-wind, will be indicated next to the wind info-box. You as the rider decide whether you are inbound (toward Alewife) or outbound (toward the Bedford Depot) and can apply the index adjustment accordingly.
The most challenging penalty to forecast is the probability of encountering a wet bike trail. The main difficulty is that data on trail wetness, needed to develop accurate forecasts of this quantity and appropriate penalties, are not routinely collected for any purpose. To fill the data gap I began performing my own validation by observing trail conditions consistently at a location near the middle of the Minuteman Bikeway in Lexington.
The resulting index values vary over a wide range all months of the year but do exhibit a definite seasonality. Bi-weekly box plots of the Pedal Index, shown here for 2015 through 2019, give a sense for what to expect for cycling comfort during different times of the year. The ups and downs in the average Pedal Index are largely a reflection of the cyclical change in air temperatures throughout the year. This drives the seasonality in the index. But the large range in index values for a given bi-weekly time period results from the various other weather conditions that can impact ride-ability, like precipitation and wind.
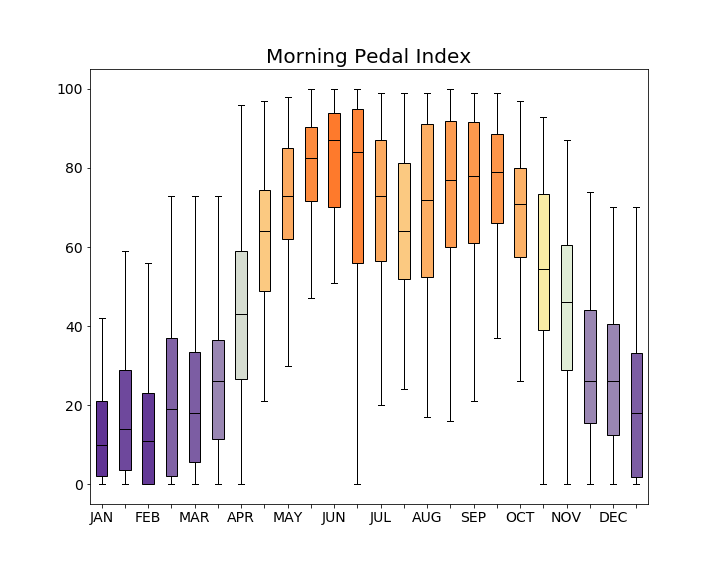
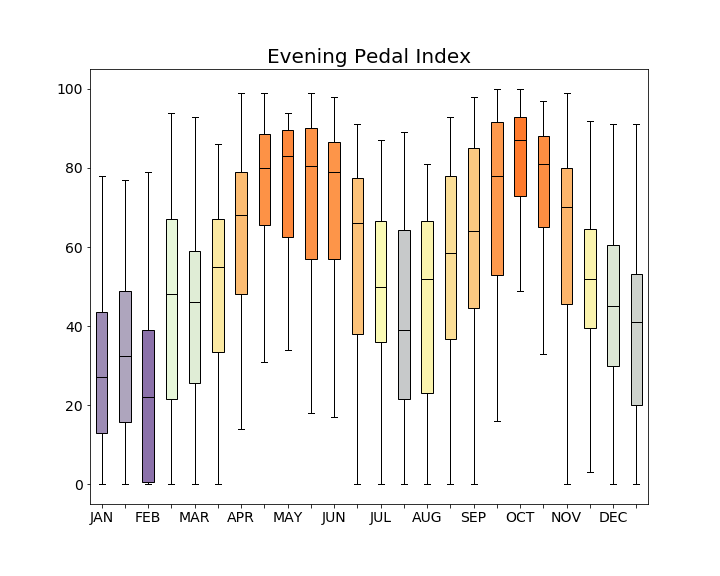
For morning cycling, summer is typically the best season because the temperatures are usually just right, although the suitability of the conditions (and as a result, the Pedal Index) is often degraded somewhat by mugginess. Those of you with an inclination toward evening rides will likely prefer the transition seasons of spring and fall before the average temperatures start to get too hot or too cold. People in New England (and in many other places) will often say that the transition seasons are too short and the weather seems almost to go directly from winter into summer, and then summer into winter. A heat map of the Pedal Index for 2015 through 2019 shows that there are nice evenings for riding in the spring and fall of every year, although some years do have less than we might like.

The heat map also suggests how unusual a perfect Pedal Index can be, either in the morning or evening. As noted above, to achieve a score of 100 requires specific conditions. The weather must have temperatures in the lower 60s with light winds, a dry trail, and without high humidity or a chance of precipitation. These conditions represent my ideal riding weather and on average they occur about five to ten times per year in the morning, mainly in early summer, and on three to five evenings per year, typically during the transition seasons.
This is a good reminder to cherish the nice weather days in this part of the world, particularly because, in contrast to the perfect score, there are several paths to a score of 0. Conditions can be unrideable simply because the temperature is below 0F (occasional) or above 105F (essentially never). More manageable temperatures can still lead to a zero index if they are accompanied by high winds, and/or precipitation. A high probability of heavy precipitation can reduce an otherwise high score down to zero especially if there is a chance of thunderstorms or severe weather to go along with it. A zero on the Pedal Index occurs about 25 times per year in the morning and fewer times in the evening, about 15 to 20, a reflection of the greater likelihood for conditions to be too cold rather than too hot to ride.

I hope that gives you a sense of what the Pedal Index is all about and how you might use it to inform your own riding on the Minuteman Bikeway and beyond. If you have any questions feel free to contact me at minutemanwx@gmail.com. See you on the trail!
A member of the Rails-to-Trails Hall-of-Fame, the Minuteman Bikeway is a 10-mile, paved rail-trail northwest of Boston that runs from the Bedford Depot to Alewife Station in Cambridge. It passes by many historical sites in the cities of Lexington and Arlington and is one of the most heavily traveled rail-trails in the country.
